Paulo Ferreira Naibert
Brazilian Seasonally Adjusted GDP
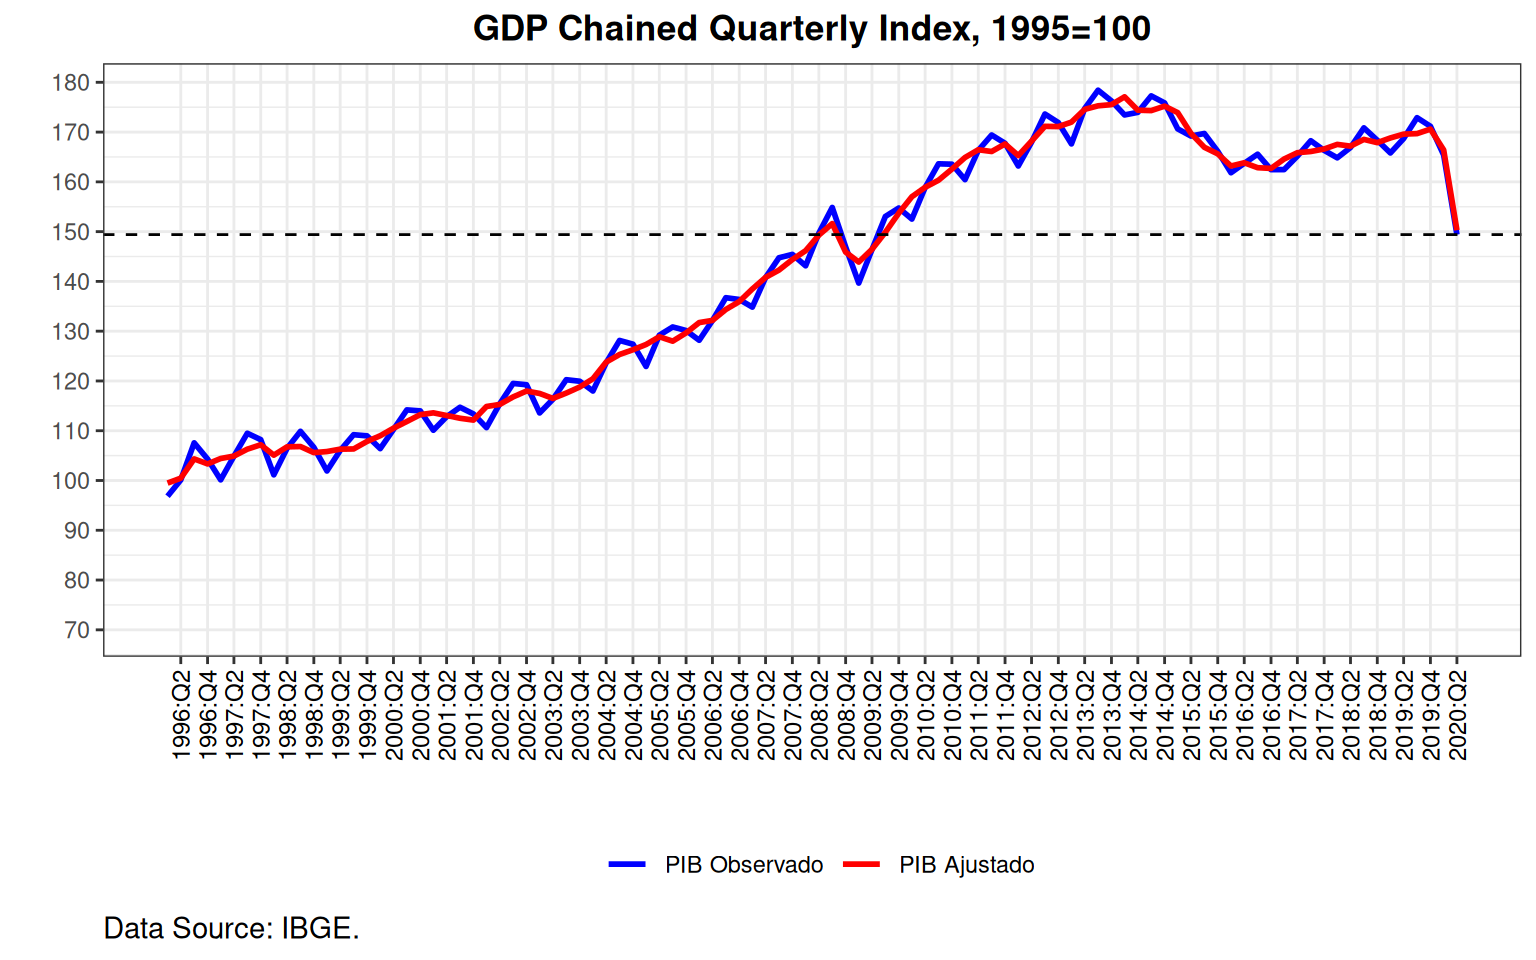
In this post, I will replicate the IBGE Seasonally Adjusted GDP from the GDP Chained Quarterly Index with the seasonal package
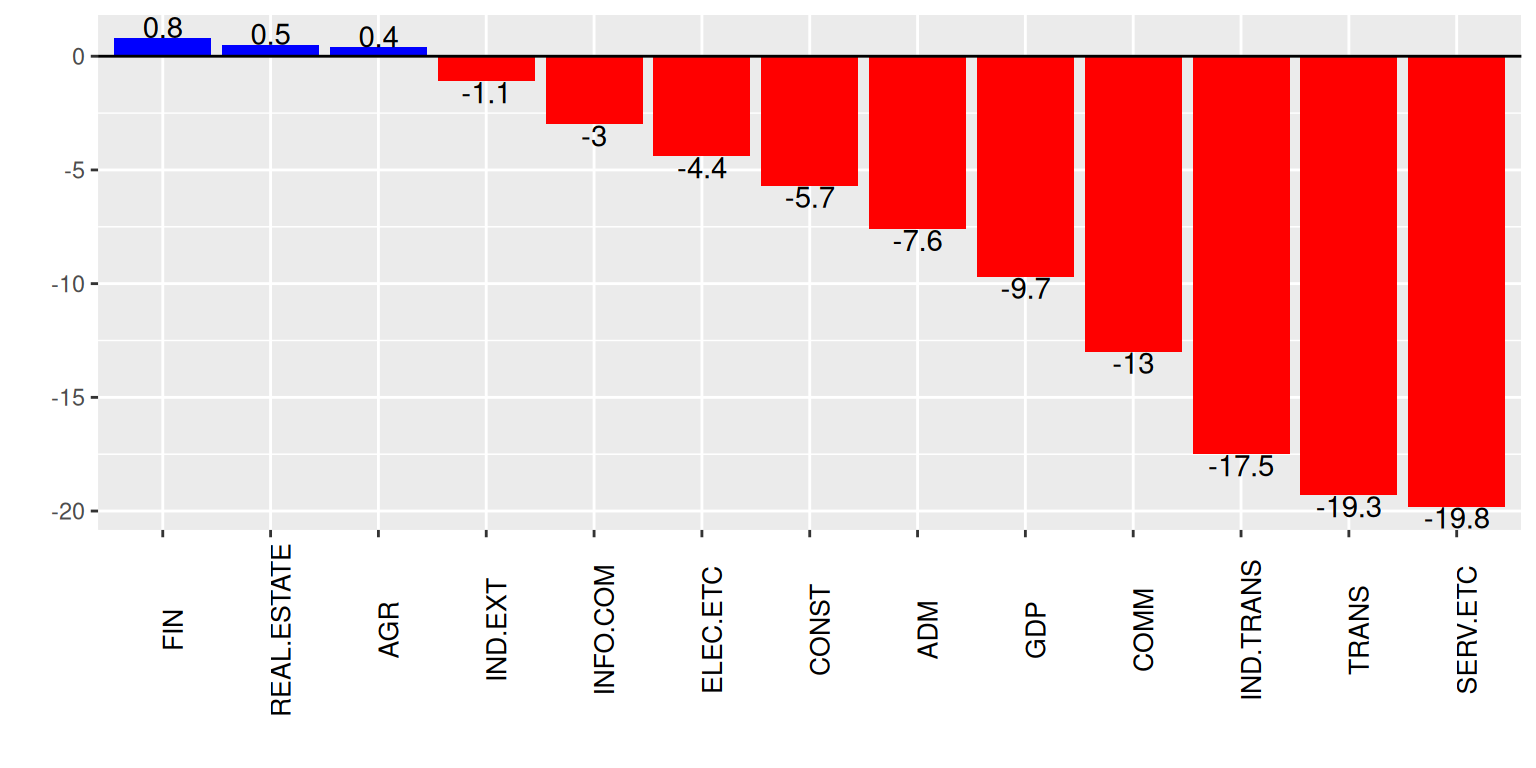
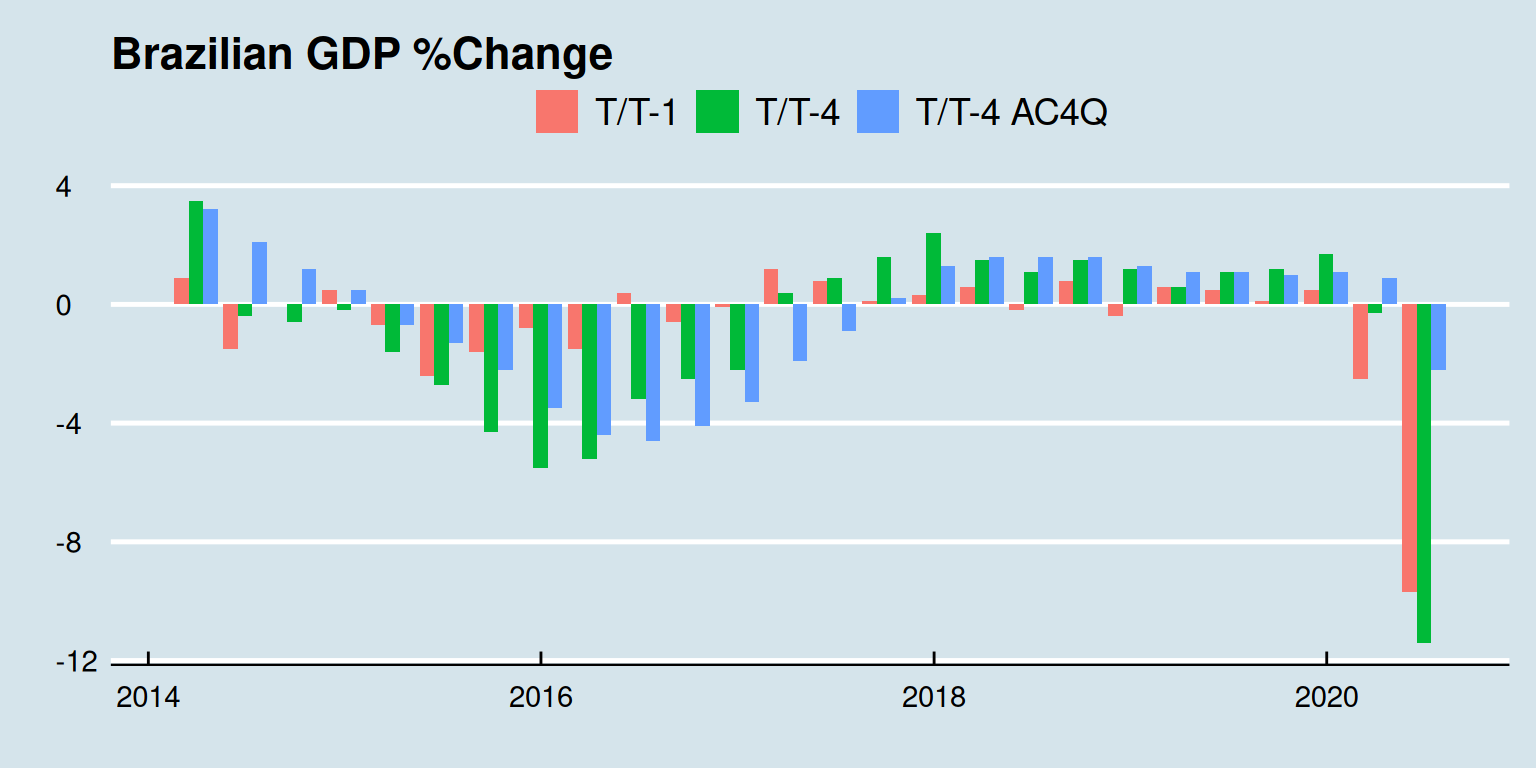
Brazilian GDP 2020:Q2
Data from the 2020:Q2 Brazilian GDP
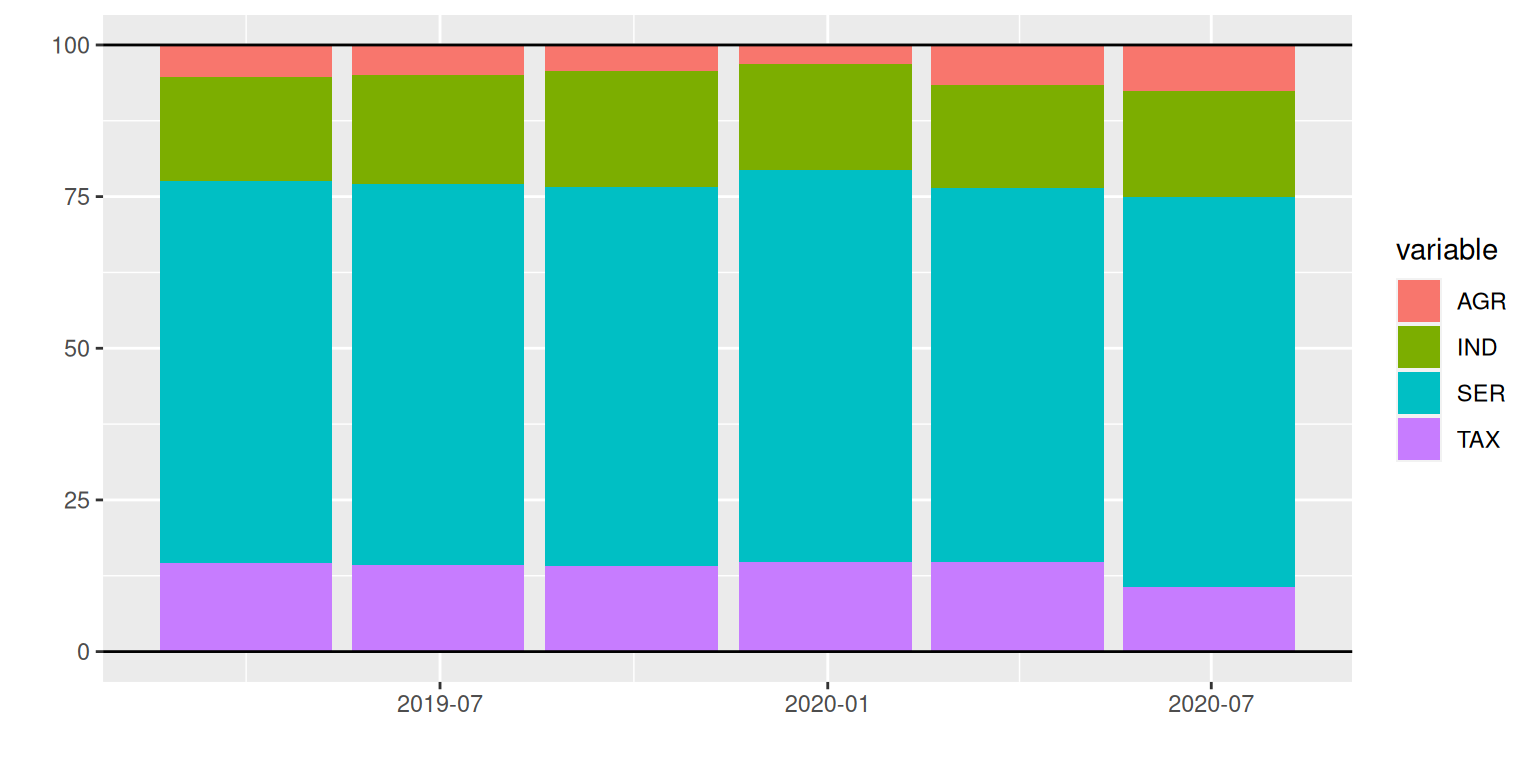
Shares of the Brazilian GDP data from the SIDRA-IBGE website
plot shares of the brazilian GDP data from the SIDRA-IBGE website
Scraping Brazilian GDP data from the SIDRA-IBGE website
Scraping Brazilian GDP data from the SIDRA-IBGE website
Interactive Plots with `dygraphs`
`dygraphs` allows us to make interactive plots in webpages.
Times Series Plots with `ggplot2`
`ggplot2` enables us to make beautiful graphics (as long as you use the tidyverse framework)
Making a wrapper to Import and Plot Data
To make research reproducible, we have to automate the way `R` performs tasks.

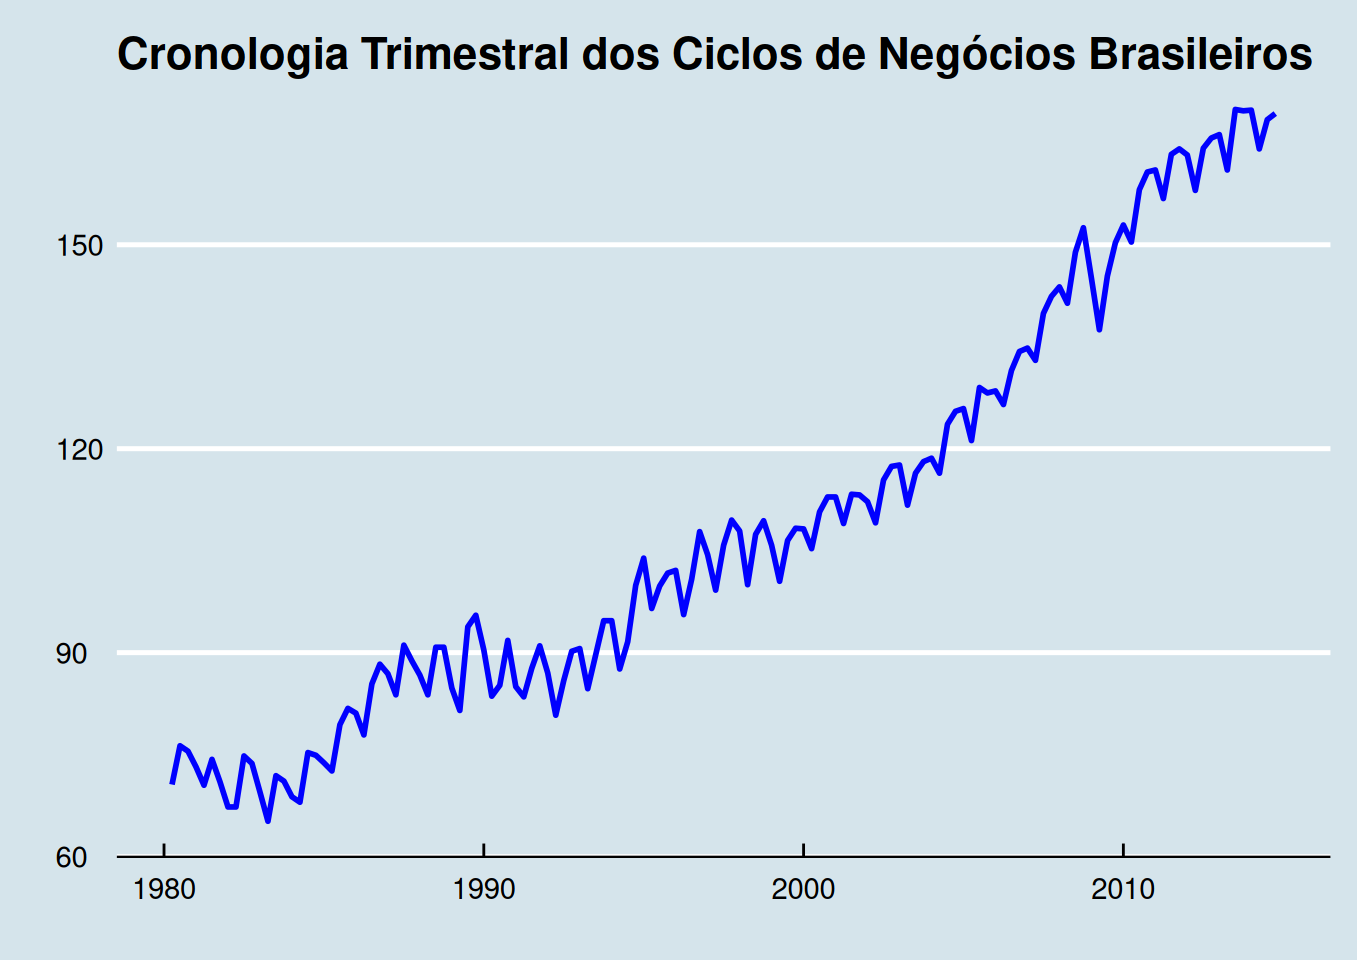
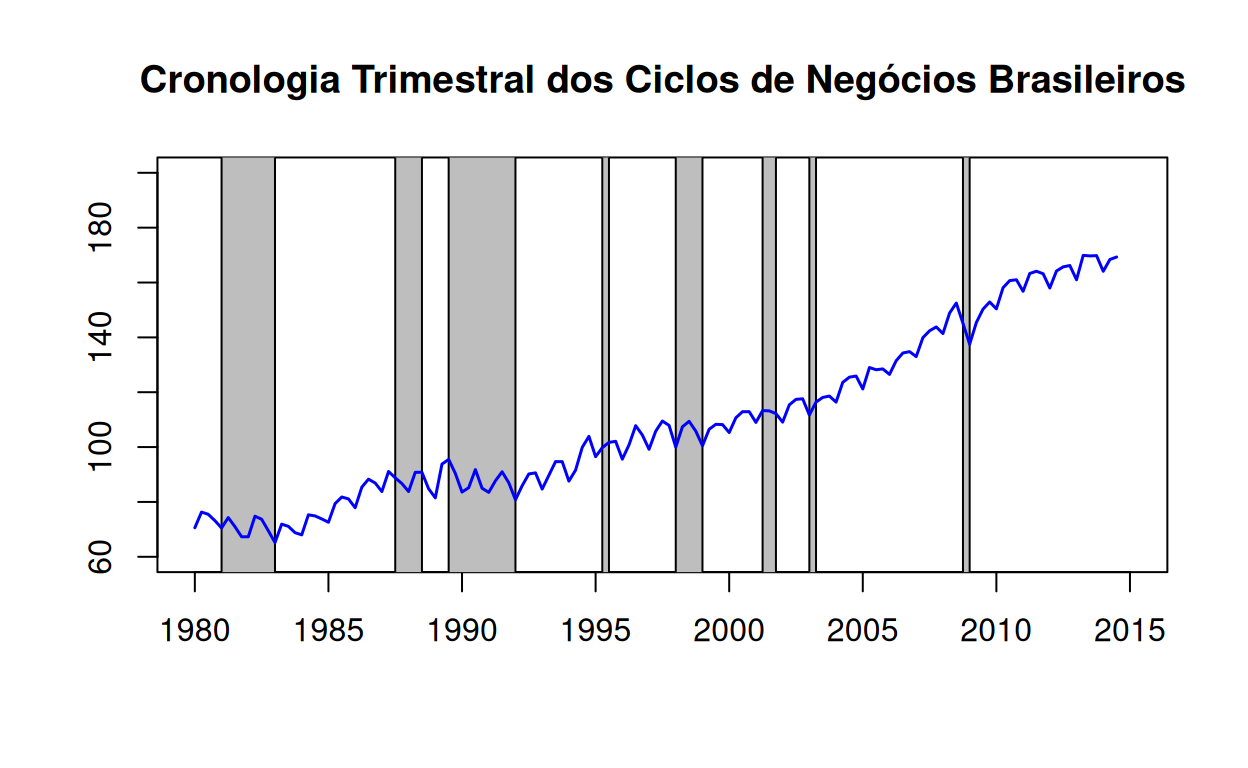
Graphing the Brazilian GDP in `R`
Graphing the Brazilian GDP in `R`.